Salah Issa, M.S.E., -Graduate Research Assistant
Yuan-Hsin Cheng, -Graduate Research Assistant
Bill Field, Ed.D., -Professor
Agricultural Safety and Health Program
Purdue University
West Lafayette, IN
For nearly a decade, Purdue’s Agricultural Safety and Health Program has published an annual summary of U.S. grain-related entrapments2 and engulfments. (www.grainsafety.us). These summaries are based on data gathered, documented, and entered into Purdue’s Agricultural Confined Space Incident Database (PACSID). With support from the U.S. Department of Labor over the past three years, the search for incidents3 was expanded to include not only entrapments at grain storage and handling facilities, but also asphyxiations, entanglements, falls, and electrocutions in and around all forms of agricultural confined spaces. This annual summary reflects this expanded effort to better understand the most critical hazards associated with a broader array of agricultural confined spaces.
The Purdue expanded surveillance effort, in addition to gathering data on injuries and fatalities related to exposure to confined spaces, now uses the following definition of an agricultural confined space in its selection of relevant cases: Any space found in an agricultural workplace that was not designed or intended as a regular workstation, has limited or restricted means of entry or exit, and has associated with it potential physical and/or toxic hazards to workers who intentionally or unintentionally enter the space.
As the result of using a broader definition for cases of interest, no fewer than 67 cases were documented in 2013. Of these approximately 51% were not related to grain entrapment. However, to ensure continuity of the data record on incidents involving grain and other free flowing agricultural materials, and due to these cases accounting for the single largest percent of incidents, special attention continues to be given to these incidents.
It should be noted that this summary also includes data on more than 160 previously undocumented cases that were entered into the PACSID since publication of the 2012 Summary of Grain Entrapment’s in the United States. This includes data from both cases occurring in 2013 and cases occurring in prior years but not previously documented. These additional cases have increased the number of previously reported cases by approximately one to two cases per year. In addition, 90-100 cases are currently being analyzed that will be added to the database following adequate review to prevent duplication and to ensure confirmation by a reliable source.
This increase in data flow can be attributed to the more vigorous surveillance efforts made possible by support from the U.S. Department of Labor, increased presence at public awareness events where contacts have been made with actual victims and on-site first responders with knowledge of specific incidents, and a general increase in public awareness that has resulted in more voluntary reporting of incidents. As noted in past summaries, the data presented do not reflect all agricultural confined space-related entrapments, engulfments, asphyxiations, entanglements, falls, or electrocutions. There continues to be no comprehensive or mandatory injury reporting system, and there is reluctance on the part of some victims and employers to report non-fatal incidents, even where extrication was required, and, therefore no public report is available.
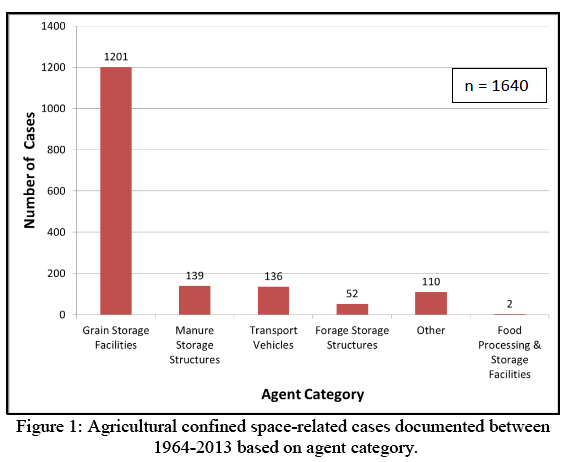
The following provides a very brief overview of all 1650 cases of agricultural confined space-related injuries and fatalities that have been entered into the PACSID. The data represents cases documented between 1964 and 2013. As noted previously, there is no claim that the data included are comprehensive; however, this report does provide the best known information available on this type of agricultural workplace hazard.
Figure 1 compares all documented cases with respect to type of agricultural confined space. As can be seen, those cases involving the storage, handling, and transport of grain and grain by-products account for the overwhelming majority of documented confined space-related cases, with over 1,200. The majority of these cases involved entrapment or engulfment in free flowing agricultural materials, primarily grain. It is known that due to less aggressive surveillance efforts, incidents involving manure storage and forage silos are significantly under-reported. Also under-reported are incidents involving entanglements and falls during the earlier years before the expanded surveillance effort began.
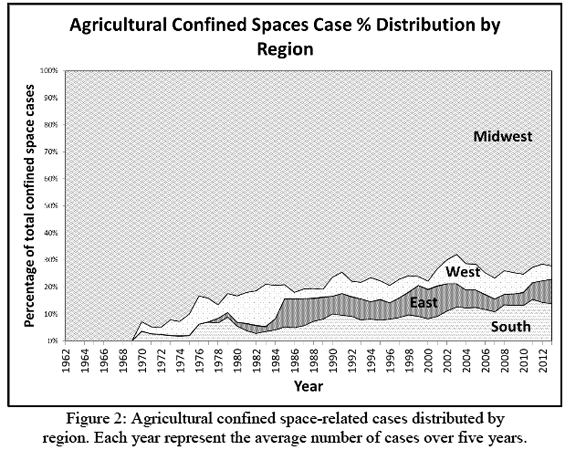
The Midwest region had the largest number of cases, with nearly 65% of all documented cases (Figure 2). However, the number of cases in the South has been steadily increasing and now represents about 15% of all cases. This trend could be attributed to the significant increase in grain production occurring in Southern states. The Western and Eastern regions fluctuate between 5% and 12% of all cases (Figure 2).
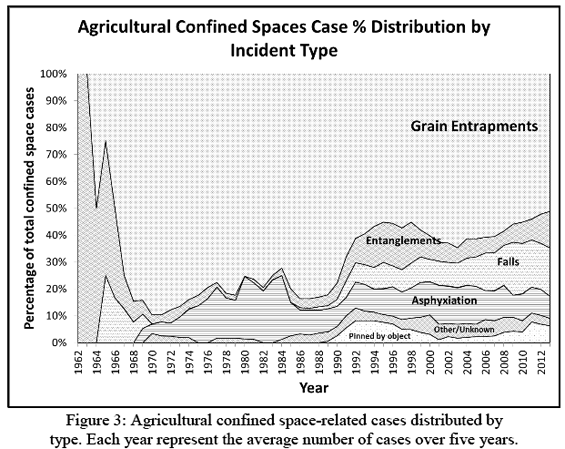
In the 1970s and 1980s, grain entrapments represented about 80% of all cases in the PACSID. Interest in related incidents has since increased and the database contents were expanded with a greater percentage of these other cases. In 2013, grain entrapments cases had dropped to slightly less than half of all cases. Meanwhile, documented fall cases have steadily increased since the 1990s and now represent about 21% of all cases, the second highest after grain entrapments (Figure 3). It is believed that falls around agricultural confined spaces, especially grain storage structures and silos, are significantly under-reported since these incidents are rarely reported in the general media. This shift in distribution of injury type is likely to continue due to the increasing awareness of other confined space-related hazards and as more aggressive data collection methods are implemented. These findings provide a better picture of the problem and are especially important to ensure that prevention efforts are being accurately targeted at the most frequent causes of injury.
A study is being conducted to summarize the data contained in the PACSID representing injuries caused by augers used inside agricultural confined spaces. This includes in-floor unload augers, sweep augers, augers used to stir grain, and silo unloader augers. In total, 167 cases were documented of which 54 (32.3%) were known to be fatal. There was also a high frequency of amputations reported from these incidents. The distribution of incidents by auger type is found in Table 1.
| Non-Fatal | Fatal | Total | |
|---|---|---|---|
| In-floor Auger | 39 (23.4%) | 9 (5.4%) | 48 (28.7%) |
| Sweep Auger | 17 (10.2%) | 9 (5.4%) | 26 (15.6%) |
| Stirrator | 1 (0.6%) | 0 (0%) | 1 (0.6%) |
| Silo Unloader | 21 (12.6%) | 15 (9%) | 36 (21.6%) |
| GTV auger | 5 (3%) | 6 (3.6%) | 11 (6.6%) |
| Unknown | 30 (18%) | 15 (9%) | 45 (26.9%) |
| Table 1: Distribution of incidents by auger type. | |||
Contrary to the general perception, even by federal regulators, that sweep augers represent the most significant risk of injury, the findings indicate the single largest source of injuries involve unguarded, in-floor augers.
Currently, the PACSID is also being used to conduct additional research on other significant causes of injury in and around agricultural confined spaces. This includes cases involving children and youth under the age of 21 and entrapments in agricultural transport vehicles including grain and manure transport vehicles. Findings will be reported at a future time.
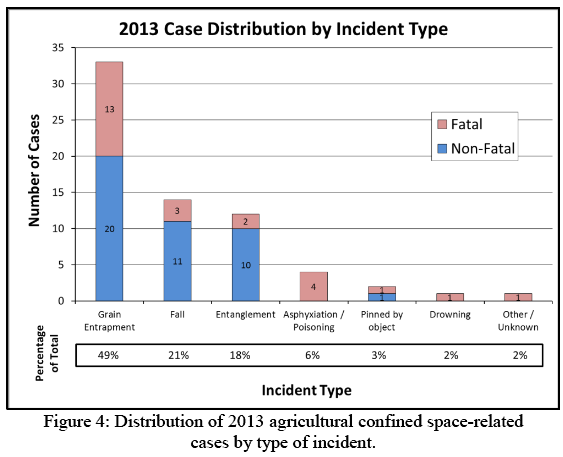
In 2013, there were no fewer than 33 grain entrapment cases, 14 falls, 12 equipment entanglements (including augers), and 4 asphyxiations (Figure 4). Grain entrapments accounted for 49% of the documented cases. For incident types with more than one case, asphyxiations constituted the most dangerous with a reported 100% fatality rate, while grain entrapments ranked second with a 43% fatality rate. Again, it is believed that incidents involving being overcome by exposure to toxic environments are under-reported.
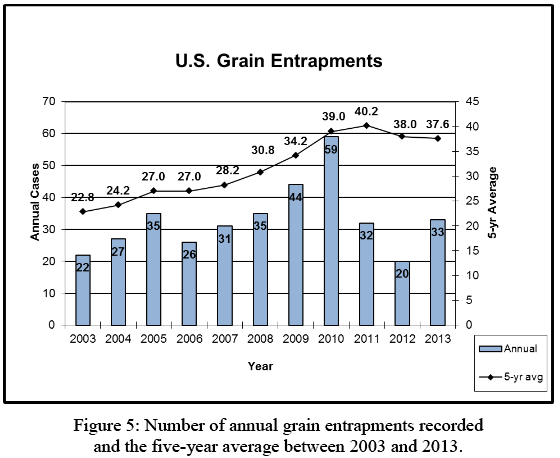
The 33 grain entrapment cases represent a 65% increase in entrapments from 2012 when 20 entrapments were recorded. The previous three years (2009, 2010, and 2011) experienced 44, 59, and 32 documented cases respectively. The five-year average continues at a relatively high level of 37.6, slightly below the peak of 40.6 in 2011. Between 1994 and 2002, the five-year average decreased from a then-record of 32.0 recorded entrapments per year (1994) to 22.8 in 2002 (the lowest since 1987). Since 2002, however, the five-year average has increased steadily back to an average of 30.8 incidents per year in 2008, 34.2 in 2009, and 39.0 in 2010, and peaking in 2011 with 40.2 cases (Figure 5).
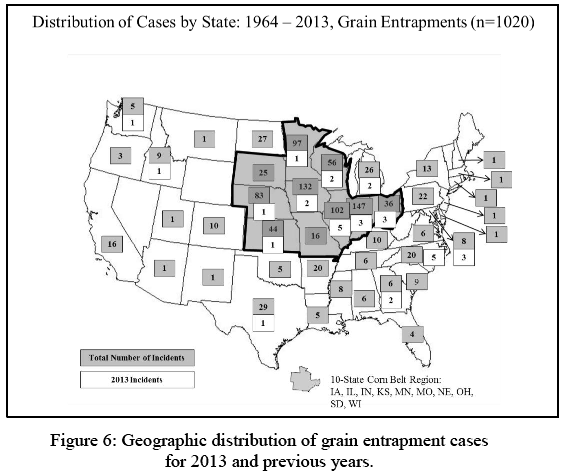
In 2013, the states with the most documented grain entrapments, fatal and non-fatal, were Illinois (5) and North Carolina (5). All of the North Carolina cases involved one incident. There Page 8 were three cases each for Indiana, Maryland, and Ohio, and two cases each for Georgia, Iowa, Michigan, and Wisconsin. Overall, entrapments were documented in 15 states in 2013. Figure 6 provides a geographic distribution of documented incidents where the location was known. It is important to note that in 2013, a third of grain entrapment cases occurred outside the Corn Belt, possibly reflecting the increased corn production in the South.
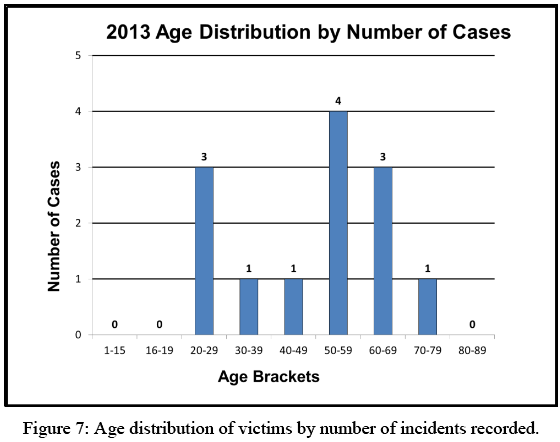
In 2013, there were 32 cases where the exemption status4 of the facility was known. Of those, 23 (70%) occurred on farms or other locations currently exempt from the OSHA Grain Handling Facilities Standards (29 CFR 1910.272), with the balance of 8 (27%) taking place at non-exempt commercial grain facilities. This is in strong contrast to 2012 when 35% occurred on exempt farms, 45% at commercial facilities and the rest were unknown. All documented victims were male. Also, there were no cases involving a youth under the age of 20, as shown in Figure 7. Overall, a specific age was known for 13 of the 33 victims in 2013, with the oldest victim being 72, and the youngest 23 years old. The average age was 49 years old, and the median age 50.
During 2013, the primary medium of entrapment, when identified, was corn (16 incidents, 48%). Soybeans were the second most common grain with six incidents (18%). Over the past thirty years corn has been involved in approximately 45% of the grain-related entrapments where the medium was known. If further inquiry were conducted on the unknown cases, it is believed the portion involving corn would be higher. Other bulk materials documented in entrapments included processed feed, rice, wheat, and pinto beans.
In 2013, the ratio of fatal to non-fatal cases continued its decline with 39% of the entrapments resulting in death. This is in comparison to 1964-2008, during which 73% of documented entrapments resulted in a fatality. Also, in 2008-2012, the percentages of incidents resulting in death were 51%, 48%, 54%, 38% and 40% respectively. Overall, the decrease in the percentage of fatal cases is believed to be due to 1) an increased emphasis on safer confined space entry procedures, 2) an increased emphasis on first responder training on grain entrapment extrication, and 3) an increased public awareness of issues related to grain entrapment and greater willingness to report non-fatal cases.
As in past years, it should be noted that this summary does not reflect all grain-related entrapments, fatal or non-fatal that have occurred. Currently over two-thirds of grain storage capacity in the U.S. is found on farms that are exempt from the current OSHA reporting requirement standards.
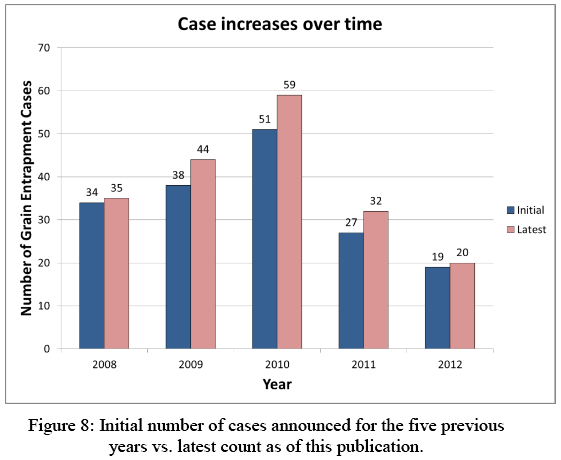
This section summarizes grain entrapment data currently documented in the PACSID overall. First, it is important to note that the PACSID database continues to improve over time and new cases continue to be discovered and documented, even for recent years. For example, there were 51 grain entrapment cases initially reported in 2010, which was revised to 57 in 2012, and again to 59 in the 2013 report. Figure 8 compares the initially reported case total and the current case total for the last five years. It is anticipated that totals will continue to be adjusted as additional cases are documented.
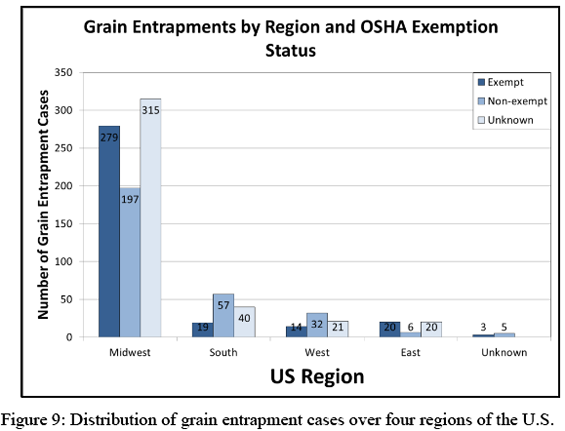
Overall, the majority of documented cases have occurred in the Midwest region (78%), followed by South (11%), West (7%) and Northeast (4%), shown in Figure 9. In recent years, the number of cases reported from the South has been increasing and this can be attributed to increased corn production in the region. It is also interesting to note the Midwest and Northeast regions have the most cases reported from exempt operations and also have more cases from exempt than non-exempt operations. These regions also exhibited the highest percentage of unknown cases. In comparison, the South and West regions reported the highest percentages of cases from non-exempt operations. This might be a reflection of the South having a greater number of major export facilities for corn and other agricultural products.
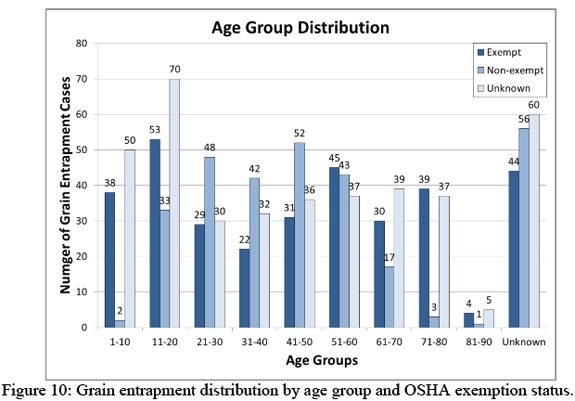
Cases involving children and youth under the age of 21 represented a major portion of the incidents contained in the PUCSID. This population was involved in approximately 20% of all documented cases, and nearly all were male (Figure 10). Cases of those ages 1-20 occurred mostly at exempt farms or facilities with unknown exemption status. The most recent high profile cases, however, were reported as occurring at non-exempt operations.
The historical high frequency of cases involving children and youth continues to remain a concern even though no cases were documented from 2013. As in the past, the most significant contributing factors continue to be the number of children and youth exposed to flowing grain hazards on exempt grain production and storage operations and the lack of experience and training within this population to recognize and avoid grain-related hazards.
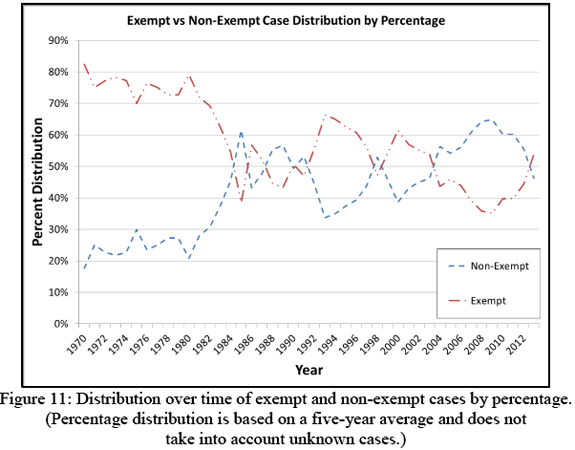
During the past year, there has been considerable interest in the distribution of documented cases between facilities that are exempt under the current OSHA provisions such as farms, feed lots, and certain seed processing operations and non-exempt commercial grain storage, handling, and processing facilities. Historically, the annual summaries have reported that approximately 70% of cases, where the determination could be made, have occurred at exempt facilities, primarily farms. Using the most current data, this distribution was closer to 50/50.
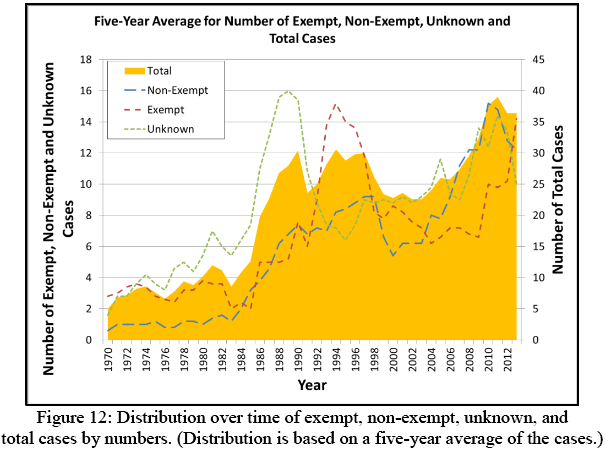
In further study of this issue, the results indicate that historically exempt facilities have, in fact, accounted for around 70% of all cases in which location could be classified. This distribution continued into the early 1980s. Since then, there has been no consistent trend and both non-exempt and exempt operations have seen a large amount of fluctuation between 40-60% of the total (Figure 11). However, these fluctuations do not take into account facilities with unknown exemption status. Overall, there were 335 (33%) cases involving exempt operations, 297 (29%) from non-exempt operations and 396 (38%) cases of unknown status in the PACSID. For a given year, unknown cases typically represented at least 30% of all cases (Figure 12). It is believed that approximately two-thirds of the unknown cases are likely to have occurred at exempt operations due to the different reporting requirements of exempt and non-exempt facilities. Until additional research is conducted to determine the nature of the unknown cases, it is not possible to confirm the distribution of cases other than that historically the majority of cases were located at exempt facilities.
As noted by on-going media coverage, the level of interest regarding agricultural confined spaces, especially grain entrapments has remained high. There continues to be development of new prevention resources, enhanced access to training opportunities and the American Society of Agricultural and Biological Engineers (ASABE) is drafting engineering standards designed to make grain storage structures safer to work around. This ongoing attention was further intensified when OSHA began to explore their regulatory options to conduct enforcement inspections on facilities that have been traditionally exempt from having to comply with the relevant standards. This effort was immediately met with criticism from national farm organizations and legislative responses from members of Congress.
Other factors that have contributed to the public attention being given to these incidents have been the high media profile given to OSHA fines for violating existing workplace safety and health regulations at grain storage operations, and the large settlements and awards resulting from civil litigation from injuries and deaths at these facilities. The message is becoming very clear that future incidents have the potential to be very costly to those who fail to comply with recognized or required workplace safety and health practices.
One of the most significant outcomes from an expanded surveillance effort to document injuries and fatalities associated agricultural confined spaces could be a better platform from which to develop and implement more effective and targeted prevention strategies. For example, falls around these spaces in 2013 account for no less than 21% of all documented cases, but the topic has received little attention in the current discussion related to the overall problem. The cases involving those under the age of 21 account for more than one out of every five, but this population still takes a second place to training emergency first responders and developing more effective rescue strategies. If prevention efforts are to be effective, the allocation of resources should be evidence-based and targeted so they will have the most long-term impact.
For additional information on this report, contact Professor Bill Field at 765-494-1191 or field@purdue.edu. In addition, refer to these sources for more information on this topic:
1Partial support for this material was provided under grant number SH235752SH2 from the Occupational Safety and Health Administration, U.S. Department of Labor. It does not necessarily reflect the views or policies of the U.S. Department of Labor, nor does mention of trade names, commercial products, or organizations imply endorsements by the U.S. Government.
2Flowing grain entrapments include both fatal engulfments and partial entrapments that require assistance in order for the victim to be extricated.
3An incident may involve multiple victims that are recorded in the database as individual cases.
4Under the current provisions of the two OSHA workplace safety and health standards most relevant to agricultural confined spaces, agricultural worksites, including most farms, feedlots, and certain seed processing operations are exempt from compliance.
Disclaimer and Reproduction Information: Information in NASD does not represent NIOSH policy. Information included in NASD appears by permission of the author and/or copyright holder. More