ASHCA 2015 Ag Safety Fact Sheet


Be Safe.
Be Profitable.

Facts and Figures about U.S. agriculture are gathered every five years by USDA's National Agricultural Statistics Service (www.agcensus.usda.gov). The most current facts are from the 2012 Census of Agriculture.

U.S. FARMS & WORK FORCE

2.17 Million Farms

2.7 Million Hired Farm Workers

731,000 Youth Working in Agriculture

  • 65% of youth are working on a family farm
  • 35% of youth are working for non-family

Hired workers (employees) perform an estimated 60% of the work on U.S. farms and about 80% of hired farm workers are foreign born.

Farms with sales ≥ $1 Million (4% of all farms) generate 2/3 of all products.

  • 87% of farms are operated by families of individuals.
  • 30% of farm operators are female.
  • 22% of farm operators are "new" having been farming less than a year.

AGRICULTURE-RELATED DEATHS

U.S. Bureau of Labor Statistics clusters agriculture with forestry and fishing. The 2013 report (www.bls.gov/news.release/pdf/cfoi.pdf) revealed the below information:

Number and rate of fatal occupational injuries by industry sector where Agriculture is the biggest fatal work injury rate per 100,000 full-time equivalent workers.

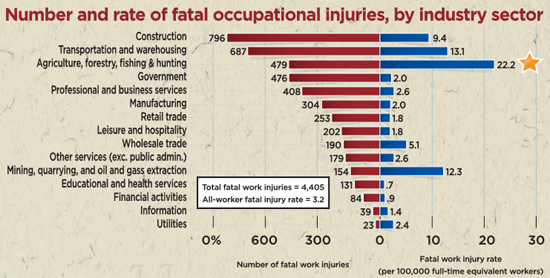
Across all industries, Agriculture/Forestry/Fishing has the highest rate of occupational deaths, followed by transportation, mining, and construction.

480 farm work-related deaths occur per year for annual rate of 22.2 deaths per 100,000 workers.

  • 115 children ages 0-19 die each year.
  • About 4/5 of these children were present in the workplace but not working.
  • Tractors are the leading cause of death, with about 125 per year. Other deaths involve livestock, falls from heights, and suffocation from grain or gases.

AGRICULTURE-RELATED NONFATAL INJURIES

There are no official statistics of nonfatal injuries; data is gathered from periodic surveys and other sources such as workers compensation data.

  • Every day, about 38 children are injured and only 20% of then were working when injured.
  • Most common work injuries:
    • Livestock
    • Falls from surfaces
    • Vehicles/Machinery
  • Every day, about 167 agricultural workers suffer lost-work-time injuries and 5% of these involve permanent impairment.

COST OF AGRICULTURAL INJURIES

  • The annual cost of occupational injures in agriculture is $8.3 Billion in medical costs and lost productivity.
  • The cost of youth deaths is $420 Million per year.
  • I $1 bills, if put end to end, those 8.3 billion dollars would stretch around the Earth's equator 31.5 times.

INJURY COSTS AT ONE FARM INCLUDE

  • Average reduced income by 30% (exceeds industry average)
  • Loss of productive worker
  • Loss of machinery that is broken or impounded
  • Reduces production outputs impacted by disruption
  • Emotional distress among witnesses and co-workers
  • Hiring, replacement and re-training costs.

The mean cost of a tractor overturn: $1,000,000

INVESTING IN SAFETY FOR PROFITS

KJ Studies show a good safety program
saves $4 to $6 for every $1 invested.


IJKB
Every $1 invested in tractor ROPS
installation yields $3.75 investment return.


Providing a safe, secure work place is a shared value
between employers and farm workers
OSHA provides a Safety Pays Calculator to determine specific savings.

Safety reduces worker injuries and illnesses-

  • Workers' compensation costs decline,
  • Medical costs decline,
  • worker morale and productivity increase.

FEEDING THE WORLD

  • The world will need about 70% more food by 2050 for the predicted 9.5 billion people.
  • Efficient, productive and sustainable agriculture includes the preservation and well-being of agricultural workers at every level.
  • Even the most efficient machinery and production systems require human operators.

Data sources: USDA Census of Agriculture, Bureau of Labor Statistics, NIOSH CAIS data, OSHA Safety Pays, J. Klodowski, AgriServices, Inc.
NTSC Fact Sheet, NARDeP Policy Bried (2013); Goldcamp, Hendricks, Meyers (2004) Journal of Safety Research

© 2015 ASHCA

ASHCA logo


For more information, please visit www.ashca.org


Disclaimer and Reproduction Information: Information in NASD does not represent NIOSH policy. Information included in NASD appears by permission of the author and/or copyright holder. More

BACK TO TOP