Instructor's Guide and Activity Materials Table of Contents
Initial Field Test Results
Approximately 400 persons were involved in the field test of the Mr. Good Egg Farmer (MGE) simulation exercise activity. Approximately 125 of these persons were adults but because of time constraints, only 15 completed the formal evaluation form. The remainder were farm youth from age 8 to 13 involved in summer, Farm Safety Day camps where time constraints also prevented completion of the formal evaluation form by the participants.
Qualitative Evaluation Results
The Mr. Good Egg (MGE) Farmer simulated tractor overturn activity was field tested with 175 farm youth at a Progressive Farming Safety Day camp in Warren County in Bowling Green, Kentucky on June 17,1997. Later on the evening of that same day the MGE simulation activity was also field tested with 12 community leaders in Barren County at the Glasgow, Kentucky Farm Bureau office. On June 17, 1997 the MGE simulation activity was field tested with 100 Barren County farm youth who attended a second Progressive Farming Farm Safety Day Camp at Temple Hill. On July 17th the exercise was field tested with 110 farmers who attended the annual Kentucky Minority Farmers Association held in Meade County. In August 1997 it was again field tested with three Fleming County adult community leaders and farmers
Because of time limitations no formal evaluation data were collected at the Farm Safety Day camp nor at the Kentucky Minority Farmers meeting. Each group of participants had only 20 minutes for the activity that was sandwiched between other activities and presenters. However, the instructors (Larry Piercy and Freddy Button for the Youth camps and Henry Cole for the Minority Farmers group) judged the MGE to be easy to use, interesting and relevant to the farm youth and adults alike, and capable of holding their interest and keeping them task oriented. Many adults asked questions and requested a copy of the materials to use with farm safety presentations they planned to conduct. The copy of a newspaper article attached to this document describes the typical participation and reaction of farmers to the exercise.
Formal Evaluation Results
The simulated tractor overturn activity was demonstrated, discussed, and formally evaluated with a one-page questionnaire with a group of 15 adults, 10 of whom reported being farmers. Ten members of the group reported that they drove tractors. The remaining persons were members of farm families who either lived (or had in the past lived) on farms. The basic demographic characteristics for these people are listed in the table at the top of page 53. Their average age was 39.6 years. Those 10 persons who farm have an average of 223.3 years farming experience. The average farm size was 215 acres, approximately the average size of Kentucky farms. Among the 1O farmers in the group, the average days per month of tractor driving is 14.8, very close to the average 15 days per month reported by a sample of 1,648 randomly selected individuals in a February 1997 survey of 1,648 Kentucky farmers in Barren, Fleming, Hardin, and Nelson Counties.
These participants rated the activity as a realistic simulation of what can happen during a tractor overturn when there is not a ROPS, when there is a ROPS but the operator is not wearing a seat belt, and when the tractor has a ROPS and the operator is wearing the seat belt. The participants also reported that the activity helped to convince them that ROPS save lives and prevent injuries, that the seat belt is valuable, that ROPS and seat belts combined can save farmers money, and that the activity helped to convince them to get a ROPS on their tractors and to use the seat belt. The analysis of the participants' demographic characteristics and responses are found on the next three pages.
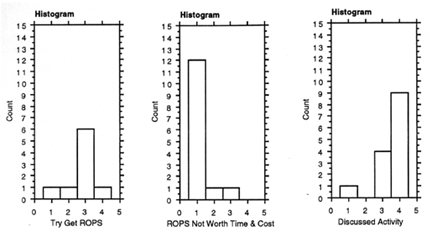
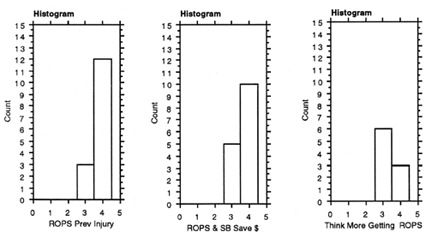
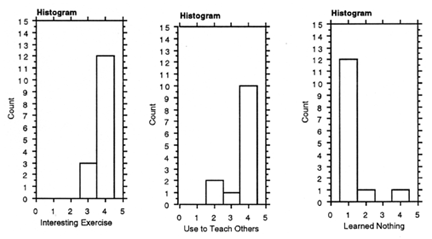
The 15 persons' high ratings of the activity can be seen from inspection of the means and standard deviations provided for each 4-point Likert scale item. The highest possible rating is a 4.0 and the lowest a 1.0. The mean ratings for the exercise for individual items listed on the evaluation questionnaire are found the table at the top of page 54 and are also listed in Table 1 on the next page. Table 1 includes the questionnaire item number and item content as well as the mean ratings. Histograms of the frequencies of persons within key demographic variable categories, and within the four Likert scale categories for each of the 13 evaluation items, are found on the next three pages.
Table 1: Participants' evaluation ratings of the Mr. Good
Egg Farmer activity
| Item No. |
| Mean* | SD |
| 9 | Activity shows what happens in real-life tractor overturns | 3.8 | 0.4 |
| 10 | Activity helped convince me ROPS save lives | 3.9 | 0.4 |
| 11 | In an overturn a seat belt holds the operator safe inside the ROPS | 3.7 | 0.5 |
| 12 | Activity helped convince me to wear the seat belt | 3.6 | 0.7 |
| 13 | Activity helped me believe a ROPS can prevent injuries | 3.8 | 0.4 |
| 14 | ROPS and seat belts on tractors can save farmers lots of money | 3.7 | 0.5 |
| 15 | Because of this activity I will think more about getting a ROPS | 3.3 | 0.5 |
| 16 | Activity has helped convince me to get a ROPS on our tractors | 2.8 | 0.8 |
| 17 | ROPS are not worth the time and costs it takes to get them | 1.2 | 0.6 |
| 18 | Had a chance to discuss the exercise and share my ideas | 3.5 | 0.9 |
| 19 | The demonstration of the tractor rollovers was interesting | 3.8 | 0.4 |
| 20 | I will use the activity to teach others about the value of ROPS | 3.6 | 0.8 |
| 21 | I didn't learn anything from this activity | 1.1 | 0.3 |
| * Maximum rating = 4, minimum rating = 1 |
Descriptive Statistics
| Mean | Std. Dev. | Std. Error | Count | Minimum | Maximum | # Missing | |
| Age | 39.6 | 13.4 | 3.6 | 14 | 22.0 | 60.0 | 1 |
| Years Farming Experience | 23.3 | 11.4 | 3.8 | 9 | 10.0 | 40.0 | 6 |
| Farm Size | 215.4 | 80.4 | 21.5 | 14 | 50.0 | 340.0 | 1 |
| Realistic Exercise | 3.8 | .4 | .1 | 15 | 3.0 | 4.0 | 0 |
| Convinced ROPS Save Lives | 3.9 | .4 | .1 | 14 | 3.0 | 4.0 | 1 |
| SB Holds Within ROPS | 3.7 | .5 | .1 | 15 | 3.0 | 4.0 | 0 |
| Convinced to Wear SB | 3.6 | .7 | .2 | 12 | 2.0 | 4.0 | 3 |
| ROPS & SB Save $ | 3.7 | .5 | .1 | 15 | 3.0 | 4.0 | 0 |
| Think More Getting ROPS | 3.3 | .5 | .2 | 9 | 3.0 | 4.0 | 6 |
| Try Get ROPS | 2.8 | .8 | .3 | 9 | 1.0 | 4.0 | 6 |
| Discussed Activity | 3.5 | .9 | .2 | 14 | 1.0 | 4.0 | 1 |
| Learned Nothing | 1.3 | .8 | .2 | 14 | 1.0 | 4.0 | 1 |
| Days Drive Trac/Month Dr | 13.1 | 10.1 | 3.4 | 9 | 0.0 | 30.0 | 6 |
| ROPS Prev Injury | 3.8 | .4 | .1 | 15 | 3.0 | 4.0 | 0 |
| ROPS Not Worth Time & Cost | 1.2 | .6 | .2 | 14 | 1.0 | 3.0 | 1 |
| Interesting Exercise | 3.8 | .4 | .1 | 15 | 3.0 | 4.0 | 0 |
| Use to Teach Others | 3.6 | .8 | .2 | 13 | 2.0 | 4.0 | 2 |


Disclaimer and Reproduction Information: Information in NASD does not represent NIOSH policy. Information included in NASD appears by permission of the author and/or copyright holder. More